
Statistics on the brand:
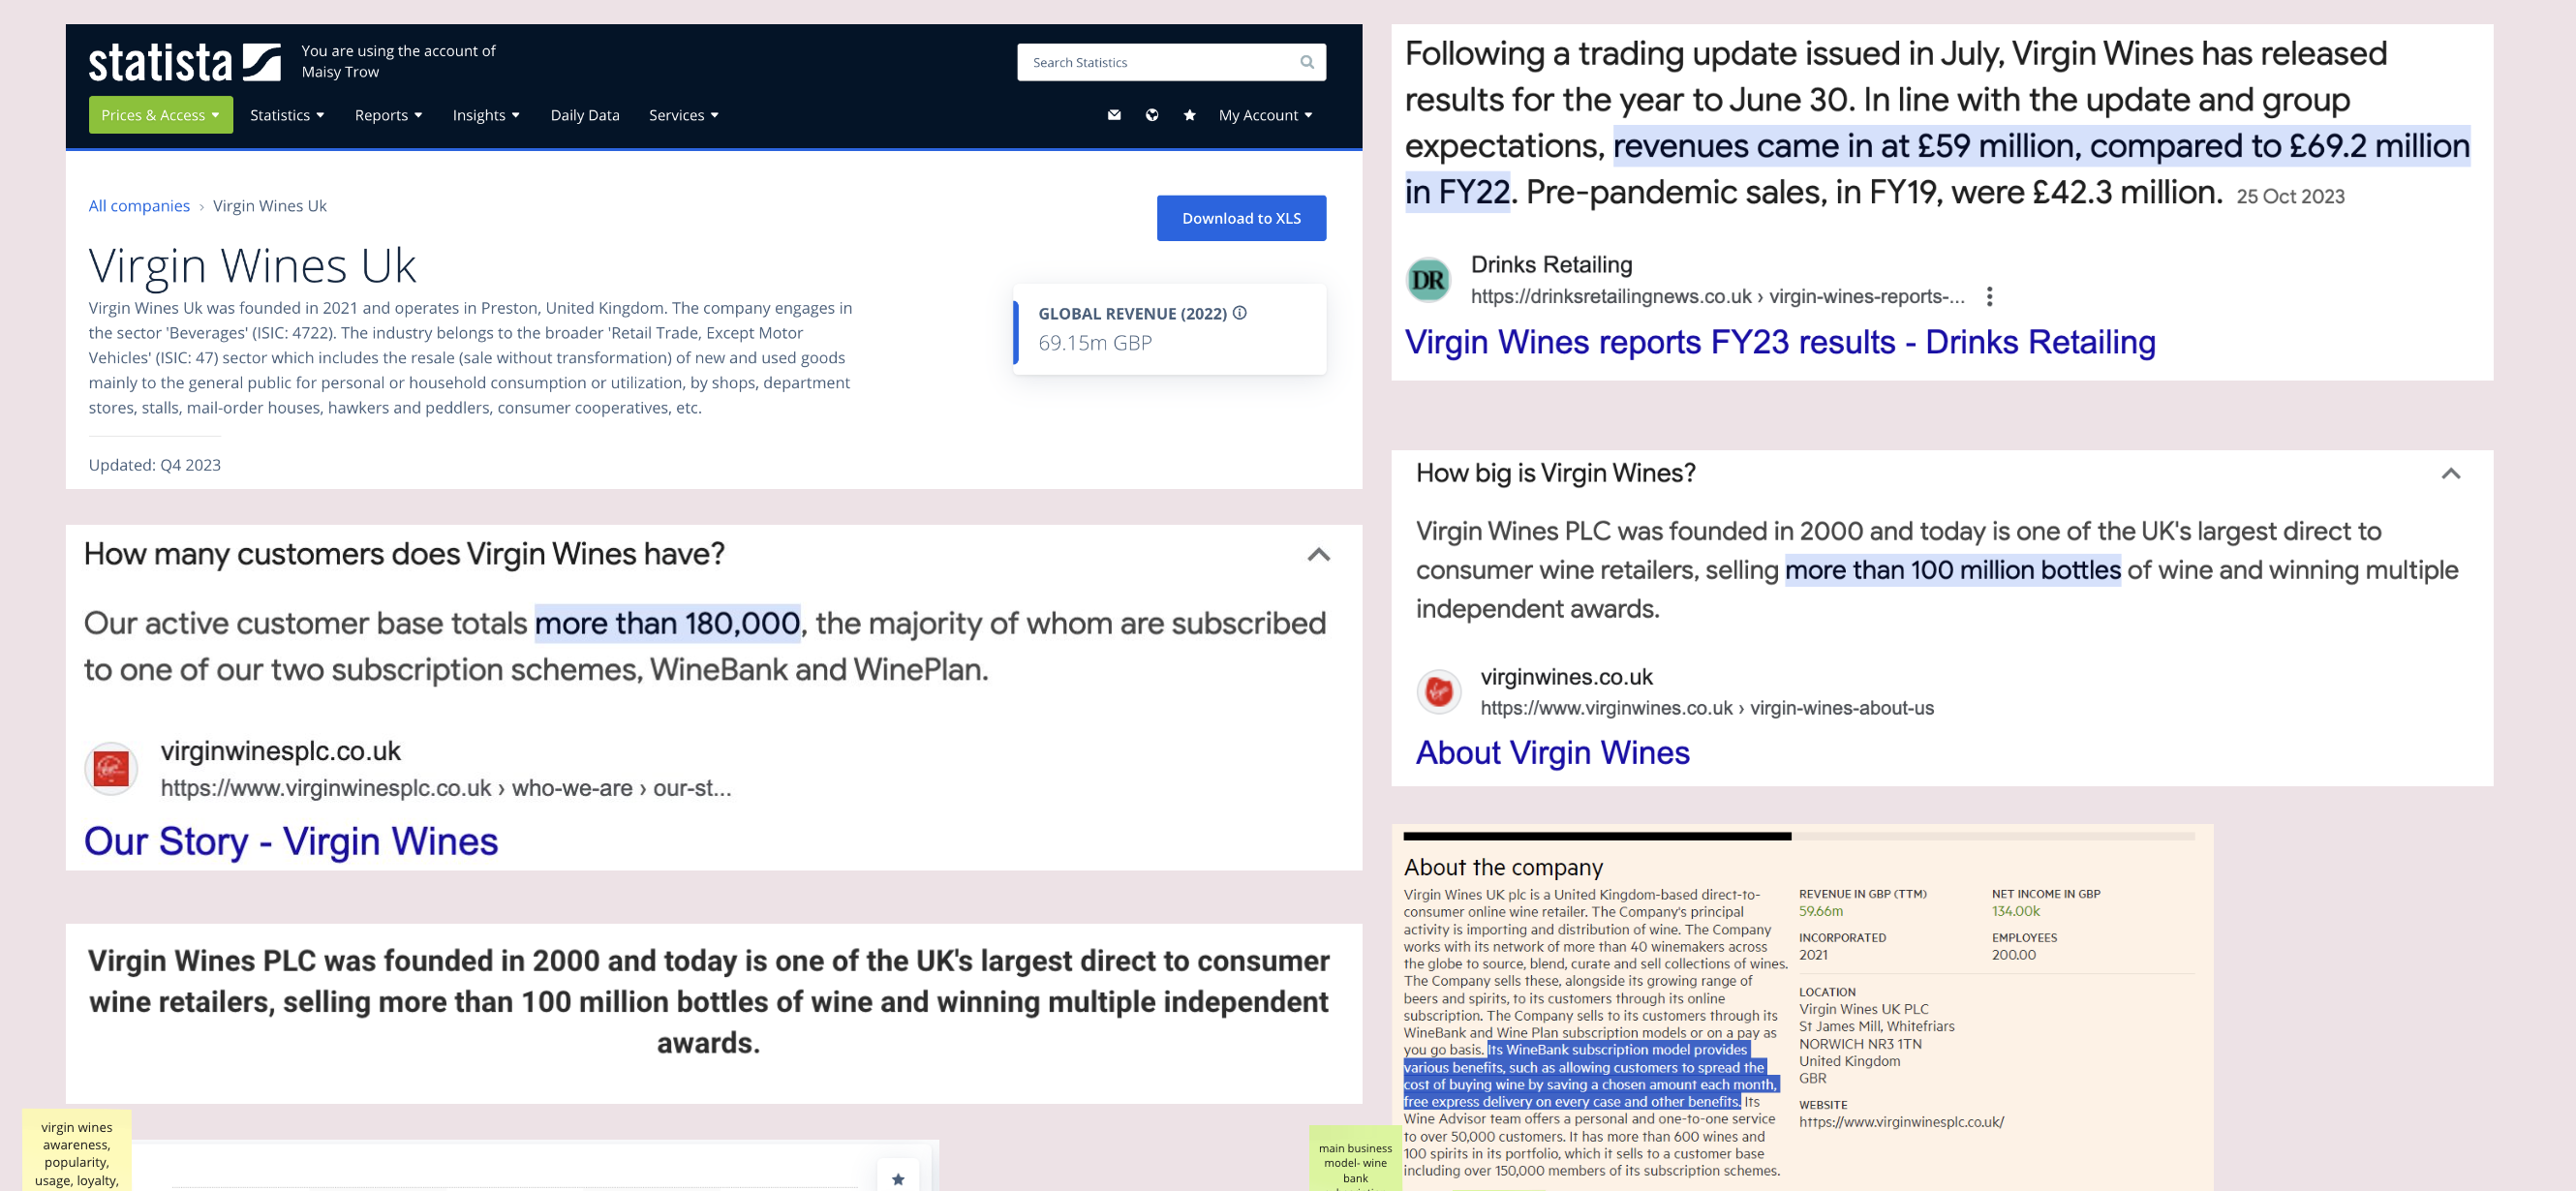
Here I gathered information about the brand in further detail by exploring various websites in order to get an insight into statistics and data around Virgin Wines. This included learning some interesting facts like how Virgin Wines have sold over 100 million bottles of wine in the 20years they have been in business. From this wondered if there are any interesting facts in which we could include with our designs that would appeal to users and even persuade them into exploring the sight further. If not the goal was to find key information that would be so eye-catching that it would linger with the user even after they have left or finished their user journey.
Other examples of short and factual statistics are:
- more than 180,000 customers
- revue’s came in at £59 million
- over 200,000 reviews
- offers nearly 700 different types of wine
- offers over 150 spirits
Notes from the Virgin Wines Lecture:
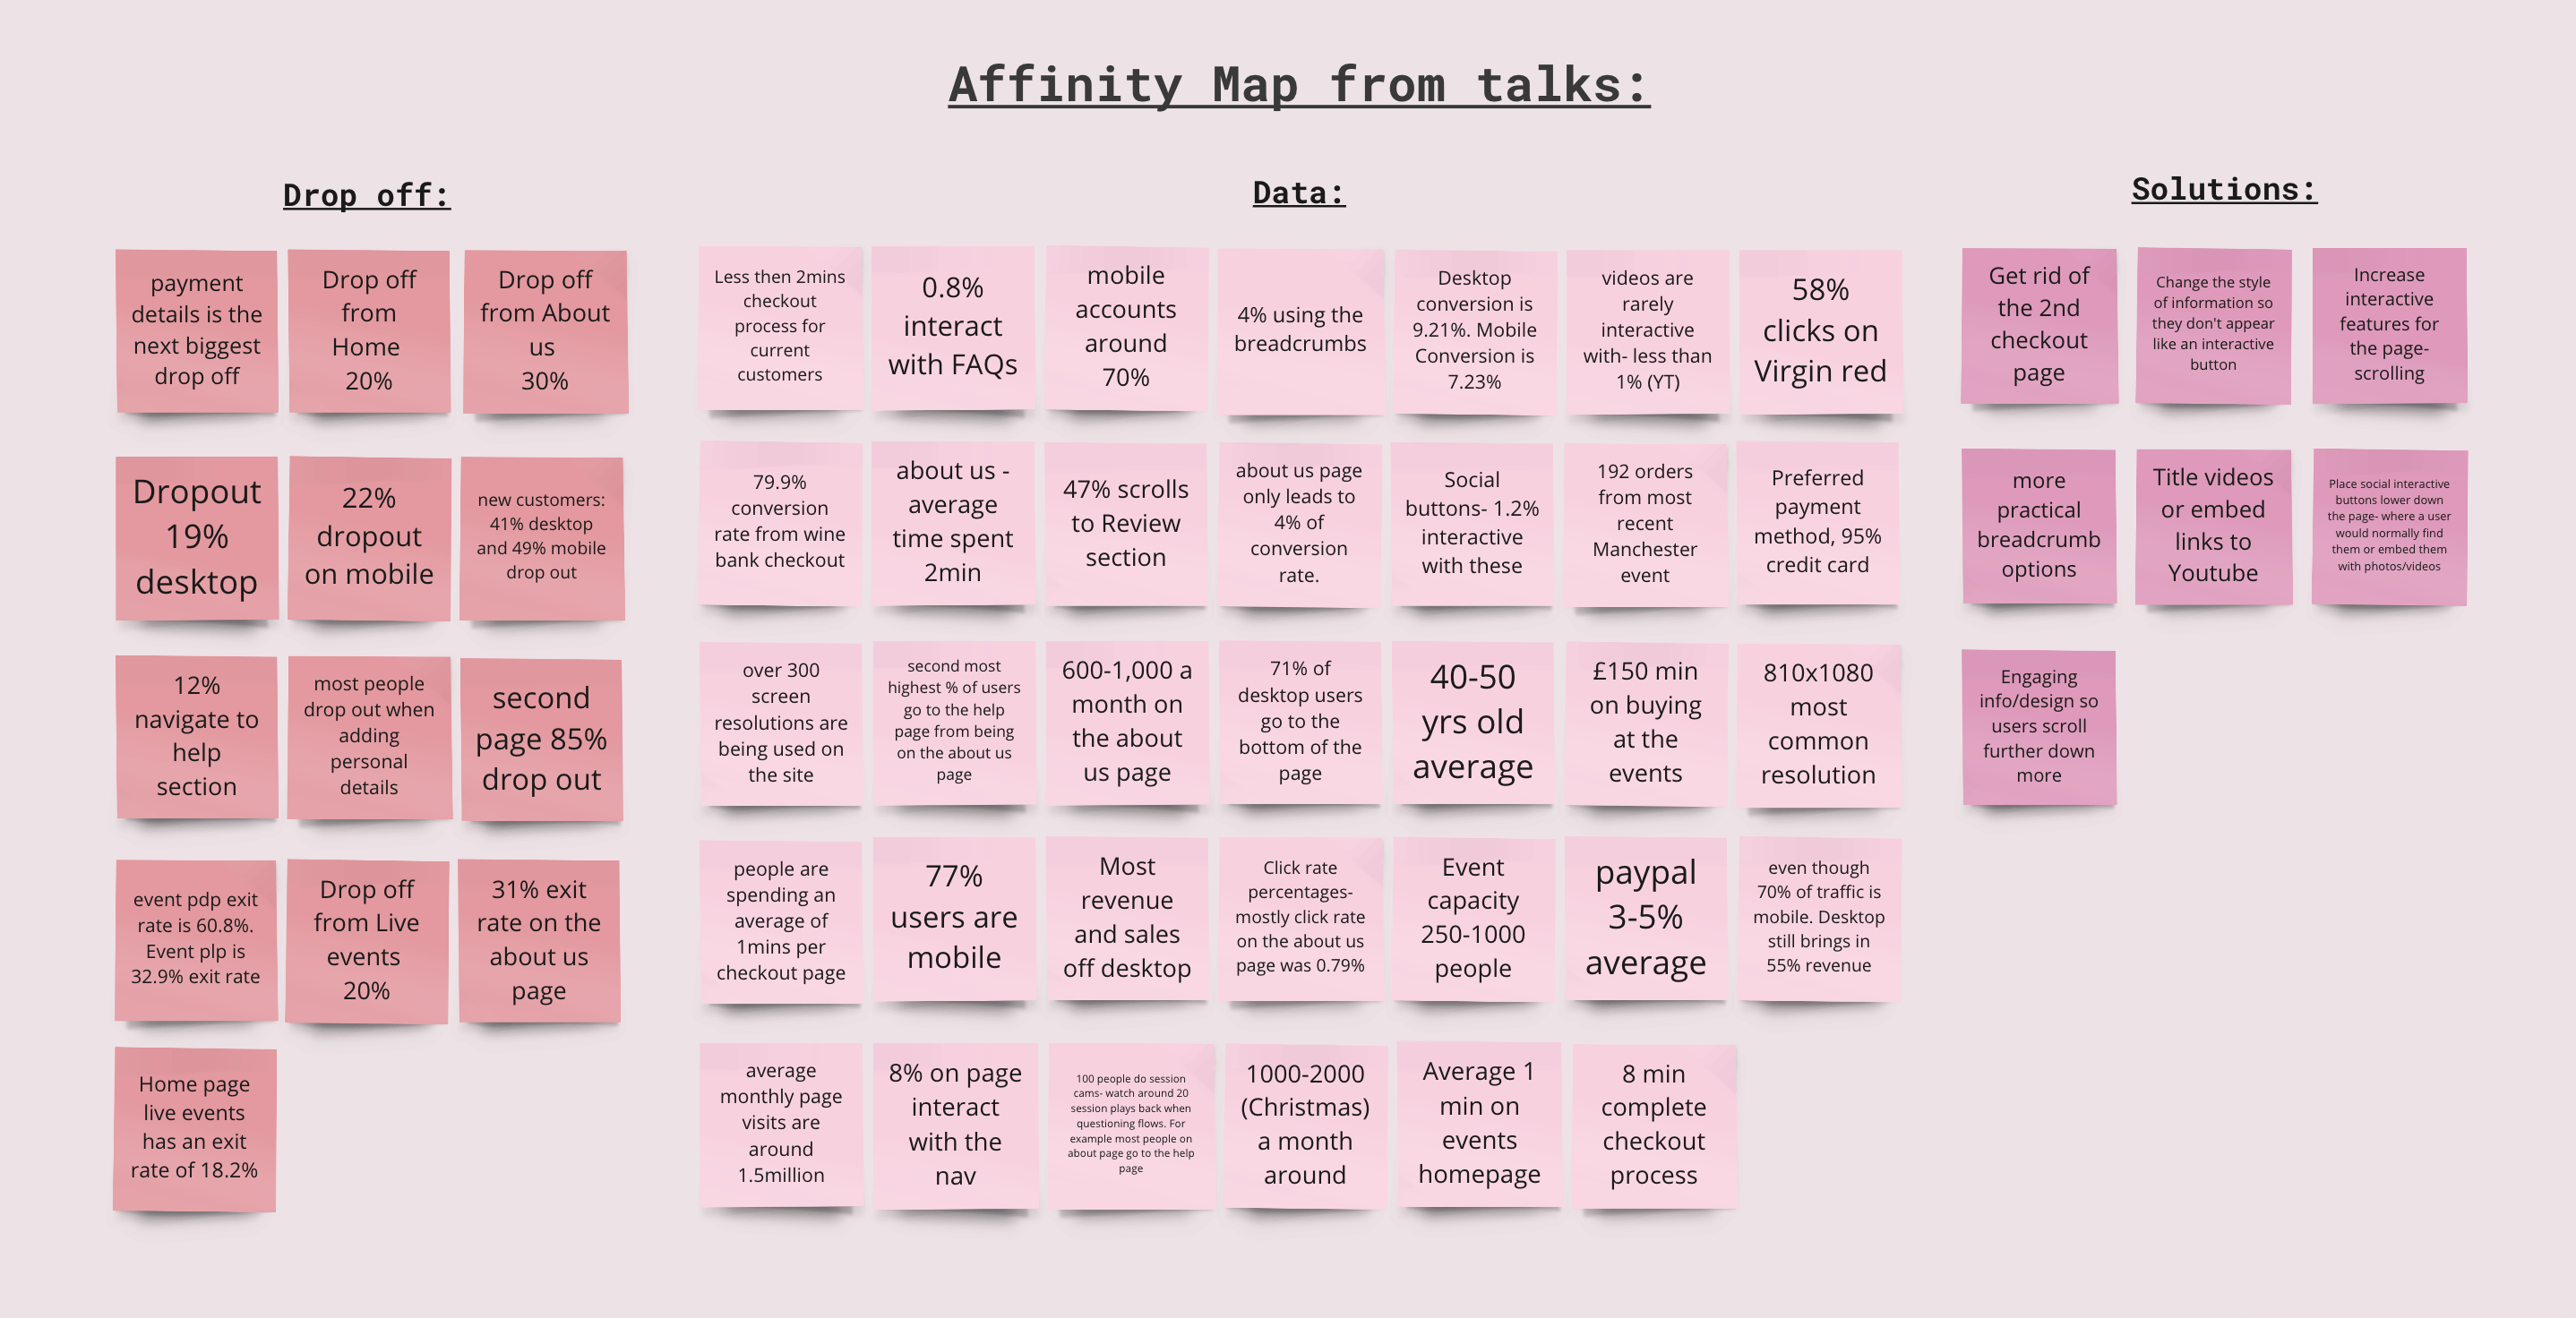
Through statistical analysis of Virgin Wines as a company and its website, our investigation revealed 3 main points:
- A substantial number of users navigating to the “Help” section while on the “About Us” page suggests that users may be uncertain about their objectives or require additional guidance.
- Since most individuals tend to drop out when adding personal details during checkout, it indicates a need for an alternative approach in this situation.
- A need to add more interactive features- 3d motion design, appealing images, anchor tags, and potentially embedded videos. Additionally, improving hierarchy and add appropriate titles where needed.
From these statistics we gathered crucial information which influenced our priories and design choices when re-creating pages. A few of these memorable insights include: preferred payment choice is credit card by 95%, payment details is the 2nd largest drop off point and only 4% use the breadcrumbs.
No Comments